Incompressible Solutions
The CoolProp project not only supports Pure Fluids wrapped by the EngCoolProp EC_Fluid object EC_Fluid Functions, but also Incompressible Solutions (e.g. Brines and Solutions) wrapped by the EngCoolProp EC_Incomp_Soln object EC_Incomp_Soln Functions.
To see a list of all incompressible fluids execute the following script:
from CoolProp import __incompressibles_solution__
print( __incompressibles_solution__ )
In March 2025, results in the list: [‘AEG’, ‘AKF’, ‘AL’, ‘AN’, ‘APG’, ‘ExampleDigital’, ‘ExampleMelinder’, ‘ExampleSecCool’, ‘ExampleSolution’, ‘FRE’, ‘GKN’, ‘IceEA’, ‘IceNA’, ‘IcePG’, ‘LiBr’, ‘MAM’, ‘MAM2’, ‘MCA’, ‘MCA2’, ‘MEA’, ‘MEA2’, ‘MEG’, ‘MEG2’, ‘MGL’, ‘MGL2’, ‘MITSW’, ‘MKA’, ‘MKA2’, ‘MKC’, ‘MKC2’, ‘MKF’, ‘MLI’, ‘MMA’, ‘MMA2’, ‘MMG’, ‘MMG2’, ‘MNA’, ‘MNA2’, ‘MPG’, ‘MPG2’, ‘PK2’, ‘PKL’, ‘VCA’, ‘VKC’, ‘VMA’, ‘VMG’, ‘VNA’, ‘ZAC’, ‘ZFC’, ‘ZLC’, ‘ZM’, ‘ZMC’]
For incompressible solutions, EngCoolProp uses units of primarily inch, lbm, lbf, sec, BTU (some use of ft and hour).:
The following are the default units for each property.

T    = Temperature = degR
P    = Pressure = psia
D    = Density = lbm/cu ft
rho  = Density = lbm/cu inch
E    = Internal Energy = BTU/lbm
H    = Enthalpy = BTU/lbm
S    = Entropy = BTU/lbm degR
Cp   = Heat Capacity (const. P) = BTU/lbm degR
V    = Viscosity = 1.0E5 * lb/ft-sec
C    = Thermal Conductivity = BTU/ft-hr-R
Default State Point
Create a listing of properties at the default state point. (i.e. T=(Tmax+Tmin)/2, P=Pmax/10):
from engcoolprop.ec_incomp_soln import EC_Incomp_Soln

# Create incompressible solution object. (without specifying state point)
ec_soln = EC_Incomp_Soln(symbol="MEG-30%", auto_fix_value_errors=False, show_warnings=2)


# Print state point
ec_soln.printProps() # Print state point
Because the freezing point of MEG-30% is above the published minimum temperature for generic MEG 0% to 60%, the minimum permissible temperature for MEG-30% was raised to just above the freezing point.
Output:
NOTICE: Tmin=311.7 degR has been increased to T_freeze + 1 = 466.4 degR
State Point for fluid INCOMP::MEG-30% (MEG-30%)
T =      569  degR,                              Range( 466.434 -   671.67) degR
P =     1000  psia                               Range(       0 -    10000) psia
D =  64.1291  lbm/cuft                           Range( 61.7671 -  65.4448) lbm/cuft
E =  36.5211  BTU/lbm                            Range(-55.0162 -  131.546) BTU/lbm
H =  39.4067  BTU/lbm                            Range(-53.6702 -  152.698) BTU/lbm
S =0.0667365  BTU/lbm degR                       Range(-0.110884 - 0.220262) BTU/lbm degR
Cp= 0.903676  BTU/lbm degR                       Range(0.863298 - 0.936644) BTU/lbm degR
V =  80.8991  viscosity [1.0E5 * lbm/ft-sec]     Range( 33.4415 -  524.521)
C = 0.280781  thermal conductivity [BTU/ft-hr-R] Range( 0.24988 - 0.307045)
    T_freeze = 465.434 degR
    rho      = 0.0371118  lbm/cuin               Range(0.035745 - 0.037873) lbm/cuin
    mass%    =        30 base mass percent       Range(0% - 60%)
Can also print short forms of properties as:
ec_soln.printTPD()

ec_soln.printTransport()
Output:
INCOMP::MEG-30% T= 569.0 P=1000.0 D=64.1291 E= 36.52 H= 39.41 S=0.067
INCOMP::MEG-30% Cp=0.903676 Visc=80.8991 ThCond=0.280781
State Point
Create a listing of properties at a given T and P. Note that Pmax is specified.
Pmax is the highest pressure considered in any iterative calcs. The default value for Pmax is 10,000 psia(see Range of P above). It is usually best to keep Pmax above the max pressure being analyzed.:
from engcoolprop.ec_incomp_soln import EC_Incomp_Soln

# Create incompressible soln object at T=500 degR, P=500 psia and max pressure = 5000 psia
ec_soln = EC_Incomp_Soln(symbol="MEG-30%", T=500, P=500, Pmax=5000) # T=degR, P=psia

# OR... After ec_soln has been crated
# ec_soln.setTP( 500, 500)

# Print state point
ec_soln.printProps()
Output:
NOTICE: Tmin=311.7 degR has been increased to T_freeze + 1 = 466.4 degR
State Point for fluid INCOMP::MEG-30% (MEG-30%)
T =       500  degR,                              Range( 466.434 -   671.67) degR
P =       500  psia                               Range(       0 -     5000) psia
D =   65.1491  lbm/cuft                           Range( 61.7671 -  65.4448) lbm/cuft
E =  -24.5781  BTU/lbm                            Range(-54.3432 -  131.546) BTU/lbm
H =  -23.1579  BTU/lbm                            Range(-53.6702 -  142.122) BTU/lbm
S =-0.0477664  BTU/lbm degR                       Range(-0.109441 - 0.220262) BTU/lbm degR
Cp=  0.877102  BTU/lbm degR                       Range(0.863298 - 0.936644) BTU/lbm degR
V =   242.449  viscosity [1.0E5 * lbm/ft-sec]     Range( 33.4415 -  524.521)
C =    0.2604  thermal conductivity [BTU/ft-hr-R] Range( 0.24988 - 0.307045)
    T_freeze = 465.434 degR
    rho      =   0.037702  lbm/cuin               Range(0.035745 - 0.037873) lbm/cuin
    mass%    =         30 base mass percent       Range(0% - 60%)
printSIUnits
Although EngCoolProp was created to promote English units when using CoolProp , it is often helpful to see properties in SI units.
For that reason, all the EngCoolProp models have a method called printSIUnits that will output the State Point with SI units. The script below shows the result of calling printSIUnits:
from engcoolprop.ec_incomp_soln import EC_Incomp_Soln

# Create incompressible solution object. (without specifying state point)
ec_soln = EC_Incomp_Soln(symbol="MEG-30%", auto_fix_value_errors=True, show_warnings=0)

# Print state point
ec_soln.printSIProps() # Print state point with SI units
Output:
State Point for fluid INCOMP::MEG-30% (MEG-30%)
T =    316.111  degK,                        Range(259.13 - 373.15) degK
P =6.89476e+06  Pa                           Range(0 - 6.89476e+07) Pa
D =    1027.25  kg/m^3                       Range(989.413 - 1048.32) lbm/cuft
E =    84948.2  J/kg                         Range(-127968 - 305976) J/kg
H =      91660  J/kg                         Range(-124837 - 355176) J/kg
S =    279.412  J/kg/K                       Range(-464.25 - 922.192) J/kg/K
Cp=    3783.51  J/kg/K                       Range(3614.45 - 3921.54) J/kg/K
V = 0.00120391  viscosity Pa s               Range(0.000497664 - 0.00780573) Pa s
C =   0.485632  thermal conductivity W/m/K   Range(0.432187 - 0.531059) W/m/K
    T_freeze =     258.574 degK
    rho      =     1.02725  g/cm^3           Range(0.989415 - 1.04833) g/cm^3
    mass%    =          30 base mass percent Range(0% - 60%)
Making Plots
An easy way to make plots is to use the matplotlib package.
To install matplotlib give the commands:
pip install matplotlib
   ... OR to upgrade...
pip install --upgrade matplotlib
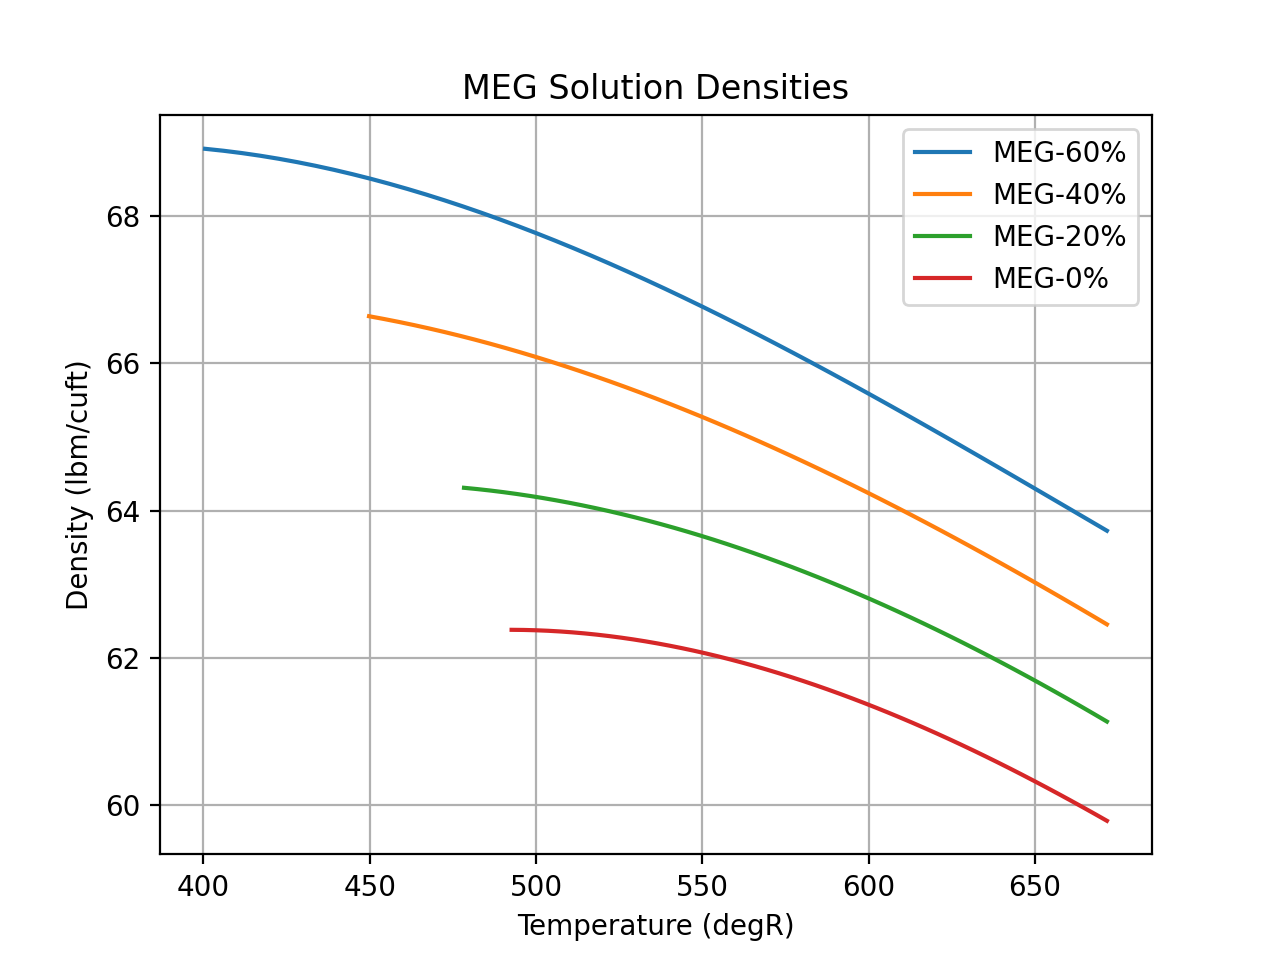
The example below will plot the density (D) of MEG for a number of solution concentrations.:
import matplotlib.pyplot as plt
import numpy as np
from engcoolprop.ec_incomp_soln import EC_Incomp_Soln

P = 1000
for pcent in [60, 40, 20, 0]:

    # Create incompressible solution object. (without specifying state point)
    ec_soln = EC_Incomp_Soln(symbol="MEG-%i%%"%pcent, auto_fix_value_errors=True, show_warnings=0)

    tArr = np.linspace(ec_soln.Tmin, ec_soln.Tmax, 50)

    densL = []
    for T in tArr:
        ec_soln.setTP( T, P)
        densL.append( ec_soln.D )

    plt.plot( tArr, densL, label="MEG-%i%%"%pcent)

plt.grid( True )
plt.title( 'MEG Solution Densities')
plt.xlabel( 'Temperature (degR)')
plt.ylabel( 'Density (lbm/cuft)')
plt.legend( loc='best' )

plt.savefig( 'MEG_pcent_D.png', dpi=200)
plt.show()